A somewhat understandable mistake made by investors is to interpret average return as typical return. These things are quite different.
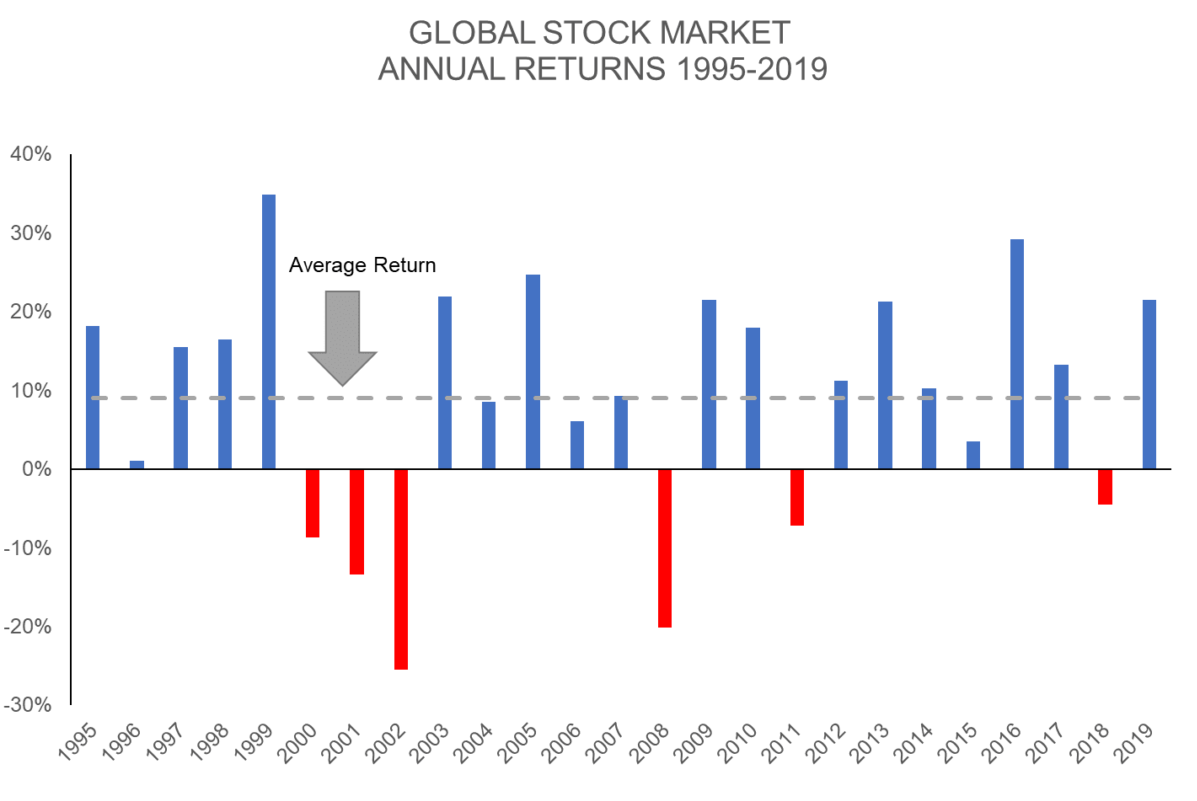
The above chart illustrates the annual returns of global stocks dating back to 1995. The average return is 9%/yr as illustrated by the grey dashed line. Notice, however, that individual annual returns were as high as a 35% gain (1999) and as low as a 25% loss (2002). In but two years (2004 and 2007) did returns come within a percentage point of the average.
The variability of returns – the proverbial turbulence – is the price we must pay. Returns if evenly distributed would remove risk. Without risk there would be no return. Therein lies the rub.
We don’t know in which years the markets will return positive or negative results so if we wish to earn market returns we have to stay invested in the market. It’s that simple.
Leave A Comment