Here’s an interesting look at the RORs of various asset classes over the past 10 years:
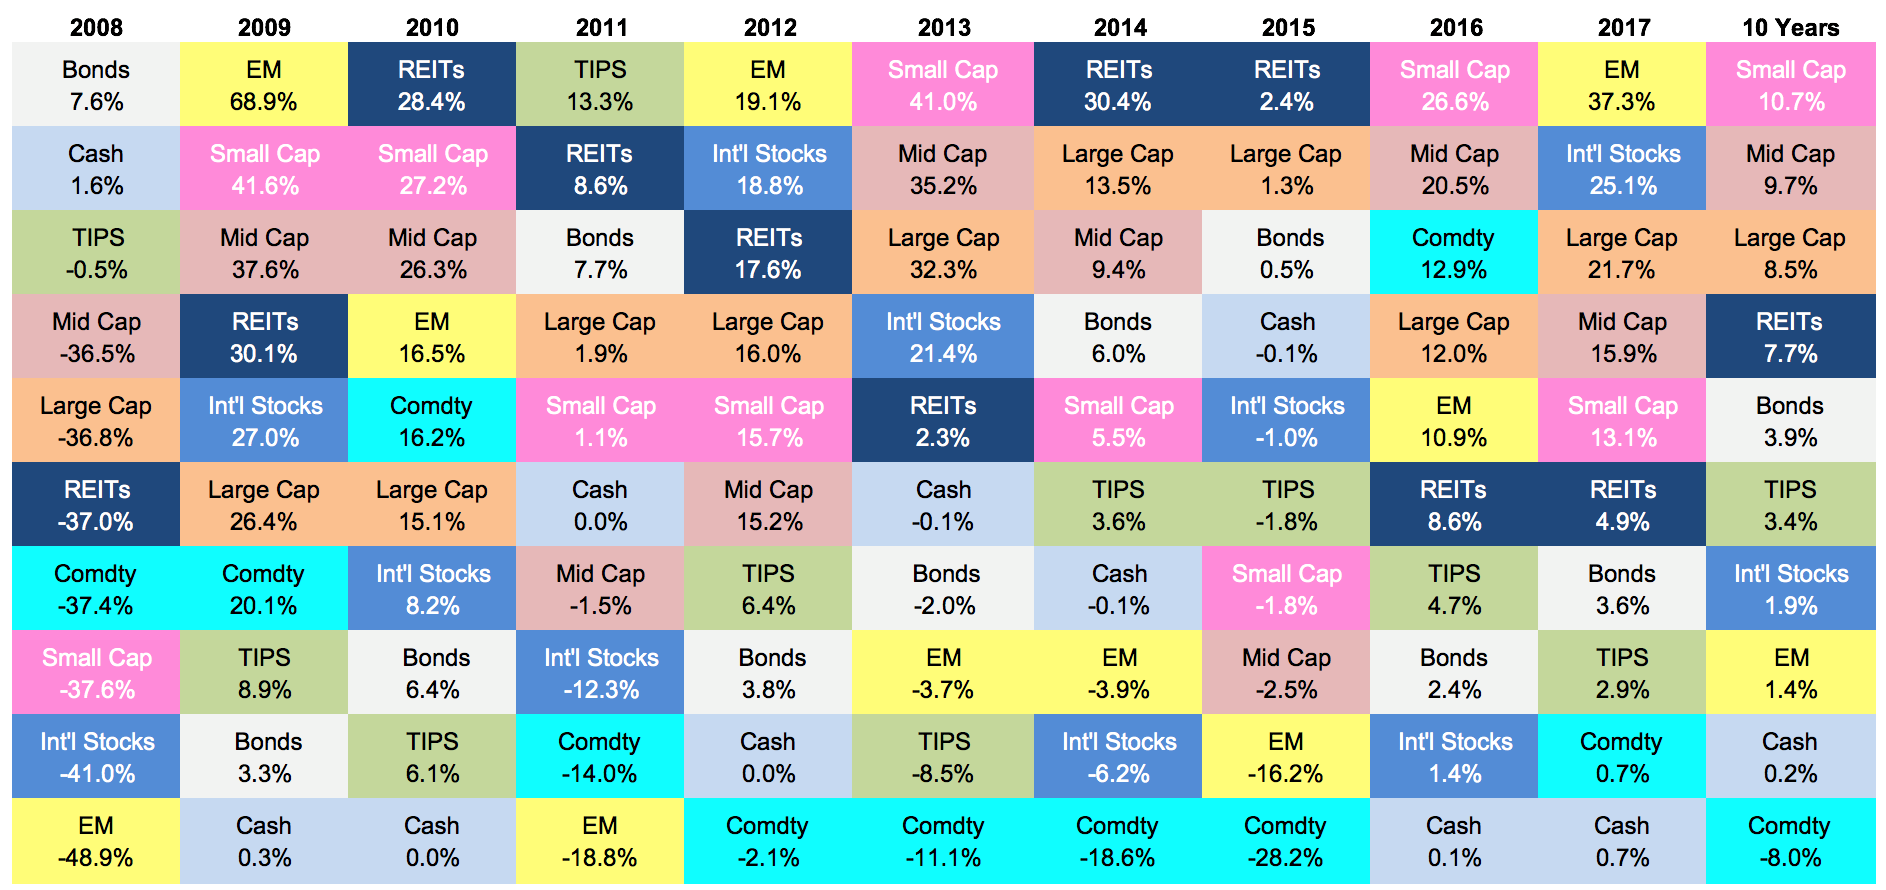
Calculated values reflect returns of the following ETFs/ETNs:
-
EM = iShares MSCI Emerging Markets ETF
-
REITs = Vanguard REIT ETF
-
Mid Cap = SPDR S&P MidCap 400 ETF
-
Small Cap = SPDR S&P 600 Small Cap ETF
-
Large Cap = SPDR S&P 500 ETF
-
Intl Stocks = iShares MSCI EAFE ETF
-
TIPS / Govt Bonds = iShares TIPS Bond ETF
-
Bonds = iShares Core U.S. Aggregate Bond ETF
-
Commodities = iPath Bloomberg Commodity Index Total Return ETN
-
Cash = SPDR Bloomberg Barclays 1-3 Month T-Bill ETF
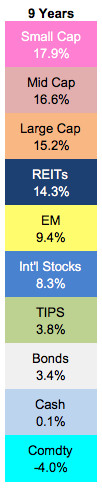
The picture looks even better when the disastrous returns of 2008 are removed (which illustrates the danger in rolling averages specifically but, more generally, assigning value to data sets without understanding how they are constructed):
Key takeaways:
- In the ST there’s almost always a difference between what was expected and what occurred. Think big picture.
- Trends are visible over the LT. That means a business cycle or two – not arbitrary 1-year or 3-year or 5-year RORs.
- Performance can be random. Predictions for future RORs are mildly educated opinions at best and coin flips at worst. Diversification should be paramount. You won’t get rich overnight and you’ll suffer from FOMO in skyrocketing markets but the risk control this discipline brings will come in handy. (Surely the lack of diversification slaughtered investors during the dot-com days of the late 90s and the real estate days of the mid 00s. It’s tortoise and hare. Slow and steady wins the race.)
- What works in one year may not work the next. Cash looks terrible now and is a poor LT option but you’d have been smart to invest in it in 2008. (No, that doesn’t mean you should market time. Shame on you for thinking that!) Even prolonged results can be misleading. Commodities have struggled but eventually there’s reversion to the mean.
Leave A Comment