Feb 2020: The S&P 500 hits an all-time high before the COVID-induced selloff.
Aug 2020: The S&P 500 recovery is complete as the index sets a new all-time high.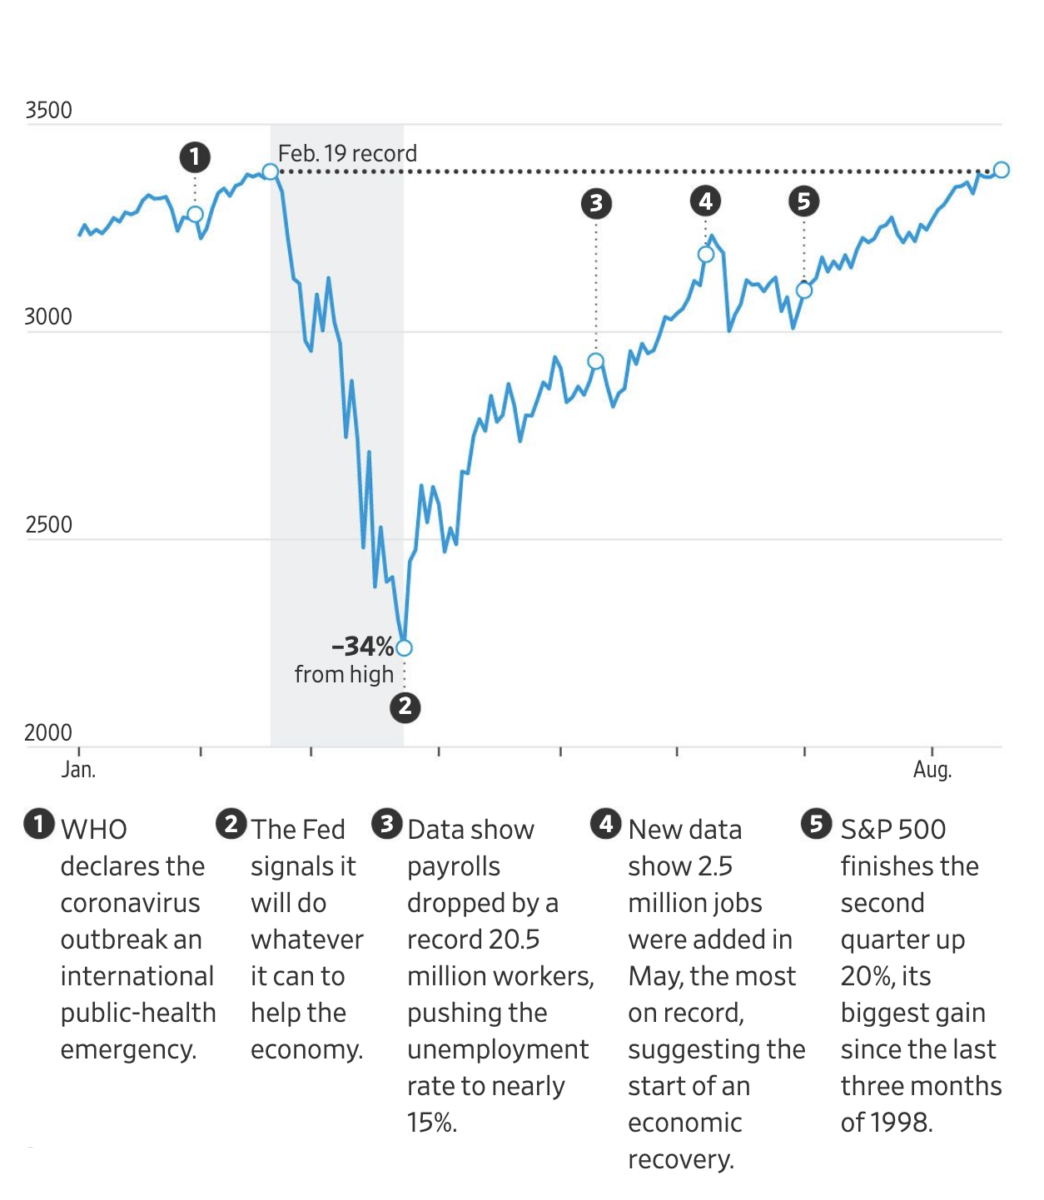
A funny thing happened along the way that’s not captured in the above graph. Earnings and projected future earnings fell off a cliff – the result of which is that the price to earnings (“PE”) ratio suggests stocks are overvalued.
By way of reminder the PE ratio is the multiple at which a stock trades. It can be calculated using trailing (i.e. prior) or forward (i.e. expected) earnings. Consider the fictitious XYZ Corp. If it earned $1/shr in the previous period and the current trading price is $20/shr then it has a trailing PE of 20. If expected earnings in the next period are $2/shr and there’s no change to the number of outstanding shares then the forward PE ratio is 10.
The trailing PE ratio of the S&P 500 (as measured against the past twelve months of earnings) is a shade over 25. It hasn’t hit this level since 2002. Similarly the forward PE ratio (as measured against expected earnings for the next year) is just under 26. It hasn’t hit this level since September 2000.
Now take a look at the historical PE ratio of the S&P 500:
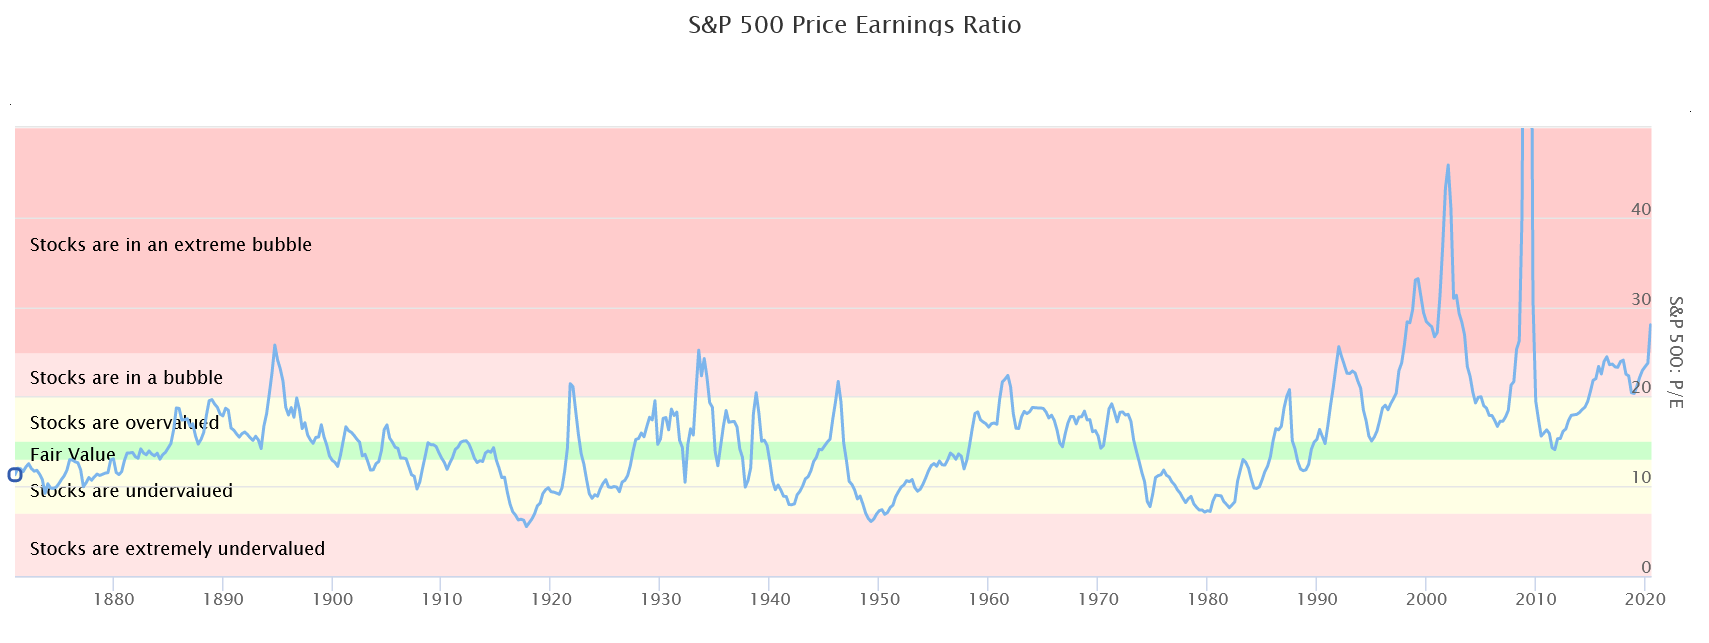
Stocks are arguably in an extreme bubble although likely a bit overstated given how Apple, Microsoft, Amazon, Google and Facebook dominate the index.
Legendary investor Warren Buffett has several times referenced his favorite indicator of valuation. He looks at the market capitalization of all public companies relative to Gross Domestic Product (“GDP”). When the two are equal he deems stocks fairly valued. When GDP exceeds the aggregate public stock market cap he deems stocks undervalued and vice versa.
Using Mr. Buffett’s rule of thumb stocks are currently overvalued.
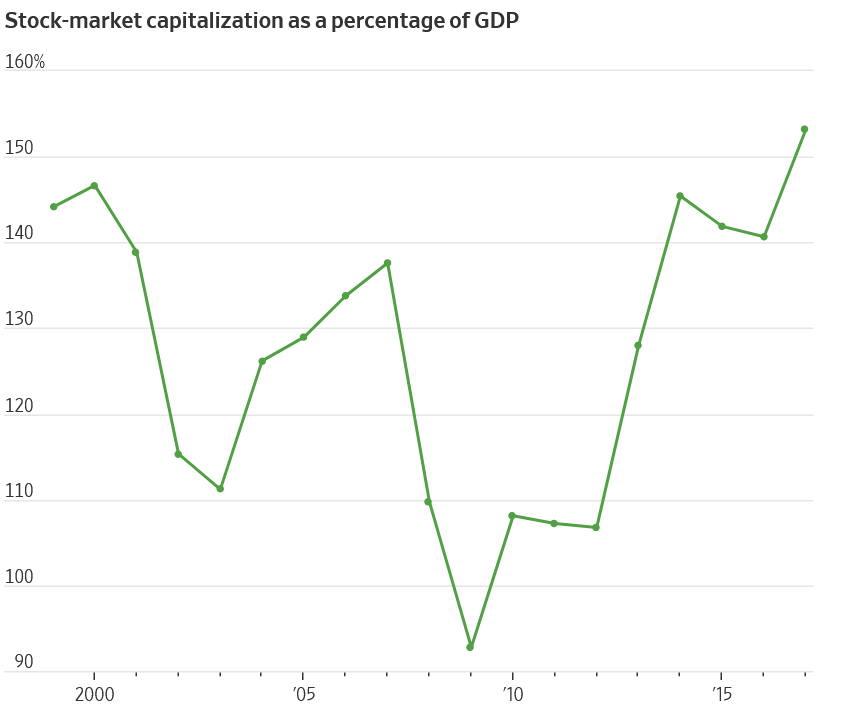
The phenomenon isn’t new. Stocks have been ahead of underlying economic activity for quite some time as aggregate market cap has exceeded GDP since 2009. Proof positive that sentiment can drive results in the face of contradictory data.
What’s happened since 2009? It’s gotten worse. The stock market’s total capitalization currently sits at $35.7 trillion. GDP for 2q20 was reported at an annualized $19.4 trillion. Stocks are worth 184% of GDP.
Investors seem to be pricing stocks for perfection.
- a safe, long-lasting and effective COVID vaccine is coming sooner than later
- more government stimulus
- an ever-accommodating Federal Reserve
- November elections that result in gridlock and force both parties away from their extremes towards the middle.
Any outcome that deviates from these expectations is sure to heighten volatility.
Stocks are overvalued. Bond yields are squeezed. Cash pays nothing (unless 0.05% APY on a 30-day CD sounds exciting). What’s an investor to do?
Leave A Comment