Lately there’s been a lot of noise about an inverted yield curve. What’s that mean and why is it important?
MEANING: Typically ST interest rates are lower than LT interest rates. The “yield curve” – a graphical plot of interest rates – would be upward sloping. An inverted yield curve is the inverse. ST interest rates are higher than LT interest rates which would graphically be a download-sloping curve.
IMPORTANCE: Questionable. Typically an inverted yield curve is indicative of recession.
IS IT CAUSAL? No. It’s an observation. Correlation is not causation. When the yield on 2-year Treasuries exceeds the yield on 10-year Treasuries we observe that the yield curve is inverted.
WHY THE NOISE? Aside from the desire for Big Media to have something to say to justify its existence the noise is overblown. It’s important to be aware that the yield curve is inverted (or in the process of inverting) but it’s one input of many. It’s one piece of a much larger puzzle.
IS RECESSION COMING? Maybe. Any answer beyond that is intellectually dishonest. Many factors are recessionary. An inverted yield curve may be indicative of recession but it isn’t causal. If recession is to come and the yield curve is indicative of such then we can use the data to get a rough idea of when. Consider the following:
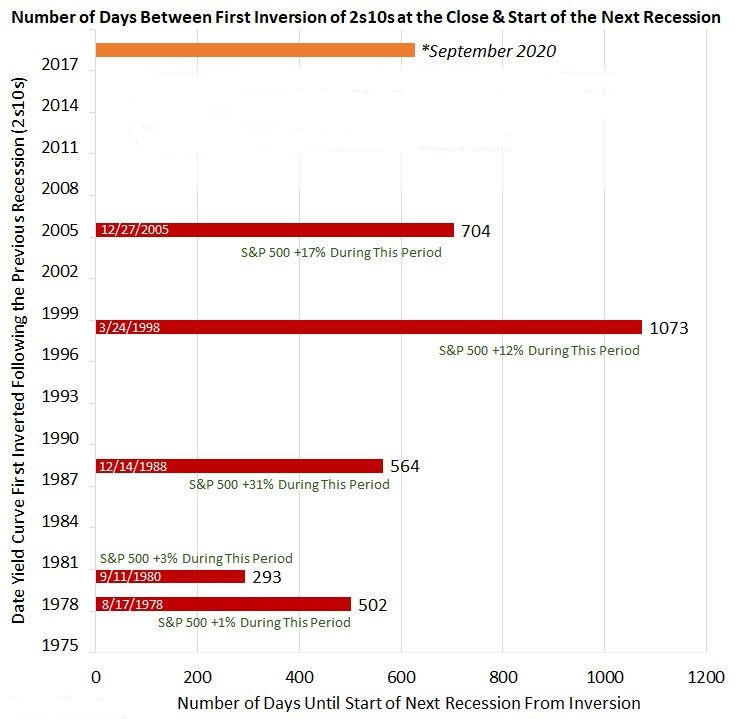
The chart shows that since 1978 there has been an average of 627 days between when the yield curve first inverts and the beginning of a recession. Applying the average and assuming the yield curve inverts today a recessionary period would begin September 2020.
WHAT TO DO ABOUT IT? Not much. It’s a data point. Nothing more.
Leave A Comment