Over the weekend Warren Buffett released his annual letter. In it he noted that Berkshire’s stock returned 11% in 2019 compared to a 31.5% total return (appreciation plus dividends) for the S&P 500. Put another way Berkshire trailed “the market” by its widest margin since 2009.
Such dramatic underperformance means Warren Buffett has lost his touch. Run for the hills!
Before rushing to judgment (do we do that in the social media age?…nah) let’s peal back the layers of the onion to see just how “bad” things are at Berkshire and understand the disparity in performance.
The first thing to note is what we always point out. The S&P 500 is not “the market.” It is not indicative of the economy or business performance. It’s nothing but a measurement of price and a poor one at that.
Originally the index was created as a basket of 500 companies offering a way to gauge in a diversified and broad manner the strength of the U.S. economy. Over time its use morphed into a means to compare portfolio performance relative to the “average” company.
The problem is as constructed the S&P 500 is deeply flawed. The index is weighted by its market capitalization. Stocks that increase in value get greater weighting and thus influence to a larger extent the overall performance of the index.
Similarly because the index is passive there is no one to ensure positions and sectors are constrained, profits are taken, positions are managed for tax efficiency, etc. Few investors take this into account.
As a result investors who buy securities that track the S&P 500 in hopes of tracking “the market” end up owning securities where the outcome is heavily reliant on an incredibly small number of stocks.
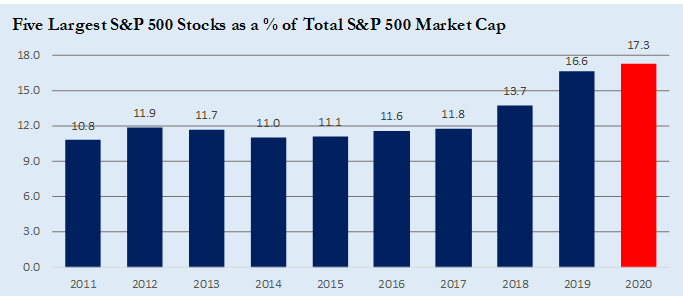
Just how many? How about five? At YE the five largest companies in the S&P 500 constituted 16.6% of the index. A few weeks ago it touched 17.3%. It’s the largest concentration since the late 1990s.
It’s not a new observation. We’ve written about it here, here, here, here and here.
How much of this concentration explains the performance of the index? Consider that from 2017 – 2019 Alphabet (Google), Amazon, Apple, Facebook, Microsoft and Netflix contributed 27% of the total “market” return.
This is diversification? It gets worse.
At YE Apple (4.6% weighting within the S&P 500) and Microsoft (4.5%) were so large they had higher weightings than four entire sectors! The stock movement of these companies is more important to the S&P 500’s performance than all the companies that comprise the Energy, Utilities, Real Estate and Basic Materials sectors. All of them! Wow! Double wow!
Now let’s look at Berkshire Hathaway. Where does Warren Buffet put his money? Top industries and sectors include insurance, railroads, utilities, manufacturing, retail and consumer goods. Boring and unsexy household names such as Coke, Dairy Queen, Duracell, Fruit of the Loom and GEICO. When the North Koreans start launching missiles, the Greek banks fail, Trump is re-elected, Trump isn’t re-elected, Brexit finally happens, Y3K eventually arrives or whatever fear-inducing headline Big Media latches on to (is the Coronavirus pandemic over yet?) are we really going to stop drinking soda, eating ice cream, buying batteries, buying underwear and insuring our stuff?
The other thing to consider is cash. The S&P 500 is a 100% stock index. Berkshire Hathaway by contrast was sitting on $128 billion of cash and short-term securities at YE. Basic math suggests that in rising markets a 100% stock index will outperform Berkshire’s stock much as the inverse will be true in a down market.
So is Warren Buffett really an idiot? Did he wake up stupid one day and forget how to allocate capital? Has he really lost his touch? Are long-running operating businesses dinosaurs or has “the market” gotten far too concentrated in technology creating far too much of an impact on the S&P’s performance?
Leave A Comment